Approximate message passing (AMP) for Massive MIMO detection, MATLAB codes provided

Note: We have recently proposed to combine LMMSE with AMP (and not using AMP alone); see Section VII in How to use AMP in Massive MIMO?

In this exposition, we want to emphasize the approximate message passing (AMP) has superior complexity when serving Massive MIMO uplink detection problems, although AMP was initially proposed for solving LASSO [DMM09]. Regarding expository details about why AMP works, please see [BM11].

The Massive MIMO architecture is to serve tens of users by employing hundreds of antennas, where the channel has its elements sampled from , , is the received signal, AWGN noise components are i.i.d with ; regarding the transmitted , we only assume that it’s zero mean and finite variance .
Before incorporating the AMP algorithm, we should be well aware of two facts: 1. directly using maximum a priori (MAP) or MMSE estimation to work with the exact prior degrade the necessity of employing AMP, because achieving a full diversity requires an extremely large set of constellation points, in which AMP works slowly while doing the moment matching process, not to mention problems about its inability to converge to the lowest fixed point. 2. In the CDMA multiuser detection theory [Verdu98, etc.], their “MMSE” detector does not mean the one working with exact prior , but rather the one assuming a Gaussian prior.
So we use a proxy prior for detecting , i.e., assuming that , even though it may be inexact. In this occurrence, we have the signal power in QPSK, in 16QAM, etc. So the target function becomes:
The AMP algorithm to solve the above problem only requires three lines (see [BM11], or our next paper which delivers a universal version of this algorithm):
where the initialization is to let , , . In terms of complexity, it only costs . Also, according to the second equation of the algorithm, it is converging extremely fast. On the contrary, MMSE has complexity . It is noteworthy that known approximation methods to MMSE, such as Richardson’s method or Newman series approximation, both fall behind the complexity-performance trade-off of AMP according to our simulations.

Now we share simulation results as well as MATLAB source codes.
128n16

%   AMP detector in Massive MIMO
%   written by Shanxiang Lyu (s.lyu14@imperial.ac.uk)
%   Last updated on 04/12/2015
function main()
clc;clear; close all;
m=128;% # of received antennas
n=16;% # of users
SNRrange=[1:20];
count=0;
for s=SNRrange
SNRdb=s;
    for monte=1:1000
    x=(2*randi([0,1],n,1)-ones(n,1))+sqrt(-1)*(2*randi([0,1],n,1)-ones(n,1));
    sigmas2=2;%signal variance in QPSK
    H=1/sqrt(2*m)*randn(m,n)+sqrt(-1)/sqrt(2*m)*randn(m,n);
    sigma2=2*n/m*10^(-SNRdb/10); %noise variance in control by SNR in DB
    w=sqrt(2*sigma2)*randn(m,1)+sqrt(-1)*sqrt(2*sigma2)*randn(m,1);
    y=H*x+w; %channel model

    %iterAMP is # of iterations in AMP
    iterAMP1=2;
    xhat1=AMP(y,H,sigma2,sigmas2,iterAMP1,m,n);
     iterAMP2=4;
    xhat2=AMP(y,H,sigma2,sigmas2,iterAMP2,m,n);

     x_mmse=(sigma2/sigmas2*eye(n)+H'*H)^(-1)*H'*y;
     x_mmse=sign(real(x_mmse))+sqrt(-1)*sign(imag(x_mmse));
    errorAMP1(monte)=sum(x~=xhat1);
    errorAMP2(monte)=sum(x~=xhat2);
    errorMMSE(monte)=sum(x~=x_mmse);
    end
    count=count+1;
serAMP1(count)=mean(errorAMP1);
serAMP2(count)=mean(errorAMP2);
serMMSE(count)=mean(errorMMSE);
end
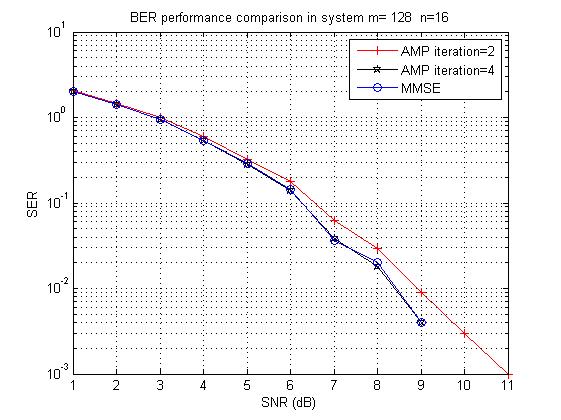
figure(1)% plot the SER
semilogy(SNRrange,serAMP1,'-+r', SNRrange,serAMP2,'-pk',SNRrange, serMMSE,'-ob');
grid on;
legend(['AMP iteration=' int2str(iterAMP1)], ['AMP iteration=' int2str(iterAMP2)], 'MMSE');
xlabel('SNR (dB)'); ylabel('SER');
title(['BER performance comparison in system m= ' int2str(m)  '  n=' int2str(n)]);
end
function xhat=AMP(y,H,sigma2,sigmas2,iterAMP,m,n)
%   AMP detector in Massive MIMO
%   written by Shanxiang Lyu (s.lyu14@imperial.ac.uk)
%   Last updated on 04/12/2015
    r=zeros(m,1);
    xhat=zeros(n,1);
    alpha=sigmas2;%initial estimation variance
        for t=1:iterAMP
        r=y-H*xhat+(n/m)*sigmas2/(sigmas2+alpha)*r;
        alpha=sigma2+(n/m)*sigmas2*alpha/(sigmas2+alpha);
        xhat=(sigmas2/(sigmas2+alpha))*(H'*r+xhat);
        end
    xhat=sign(real(xhat))+sqrt(-1)*sign(imag(xhat));
end

On cryptography and web-security

To spare the hours doing my PHD, I am recently watching the cryptography online courses provided by Prof. Dan Bobeh. For those who may be interested in what “cryptography” and “web-security” are doing, I have drawn two figures to highlight my understanding.

crypto

Slide1


Showing the decoding radius of SIC is larger than that of ZF

Zero forcing (ZF) and successive interference cancellation (SIC) are among the most popular sub-optimal approaches to perform a MIMO detection.  Ref. [1] serves as a great analytic perspective to look at the decoding radius of ZF, SIC and their lattice reduction counter parts. However, the statement about the size comparison of SIC and ZF decoding radius is still away from ‘nice and clear’, i.e.,

(pp. 2799, para 2 on the left column)”Since \hat{b}_i only needs to be orthogonal to {b}_1, \ldots,b_{i-1}, we must have \theta_i\leq\phi_i and hence d_{i,ZF}\leq d_{i,SIC}“.

In this post, we try to establish a proof about “d_{i,ZF}\leq d_{i,SIC}“.

First of all, necessary notations are given, as those in Ref. [1]. Let d_{i,ZF} be the Euclidean distance from point 0 to the i-th facet of the decision regions of ZF and SIC, respectively. Then the distance spectrum of them are given by:

d_{i,ZF}=\frac{1}{2}||\mathbf{b}_i||\sin \theta_i\\ d_{i,SIC}=\frac{1}{2}||\mathbf{b}_i||\sin \phi_i

where \theta_i  denotes the angle between \mathbf{b}_i and the space span by all the rest columns of matrix \mathbf{B}, and \phi_i is the angle between \mathbf{b}_i and the space span by the columns before i. We dubs the two notations as

\theta_i=angle(\mathbf{b}_i,span(\mathbf{B_{[-i]}))

\phi_i=angle(\mathbf{b}_i,span(\mathbf{B_{[1\sim i-1]}))

In order to show that \sin \theta_i \leq \sin \phi_i, it is indeed showing

\frac{||Proj(\mathbf{b}_i,span^\perp (\mathbf{B}_{[-i]}))||}{||\mathbf{b}_i||}\leq\frac{||Proj(\mathbf{b}_i,span^\perp (\mathbf{B}_{[1\sim i-1]}))||}{||\mathbf{b}_i||}

where the “Proj” operator means taking the projection of vectors onto their orthogonal complement. Let the normalized Gram-Schmidt basis of \mathbf{B} note as \hat{\mathbf{B}}=[\hat{\mathbf{b}}_1,...,\hat{\mathbf{b}}_n], then we have

{||Proj(\mathbf{b}_i,span^\perp (\mathbf{B}_{[-i]}))||}= ||\hat{\mathbf{B}}_{i}\hat{\mathbf{B}}_{i}^{\mathrm{T}}\mathbf{b}_i||

{||Proj(\mathbf{b}_i,span^\perp (\mathbf{B}_{[1\sim i-1]}))||}= ||\hat{\mathbf{B}}_{[i\sim n]}\hat{\mathbf{B}}_{[i\sim n]}^{\mathrm{T}}\mathbf{b}_i||

where ||\hat{\mathbf{B}}_{i}\hat{\mathbf{B}}_{i}^{\mathrm{T}}\mathbf{b}_i||=||\hat{\mathbf{b}}_{i}\hat{\mathbf{b}}_{i}^{\mathrm{T}}\mathbf{b}_i|| and ||\hat{\mathbf{B}}_{[i\sim n]}\hat{\mathbf{B}}_{[i\sim n]}^{\mathrm{T}}\mathbf{b}_i||= ||\hat{\mathbf{b}}_{i}\hat{\mathbf{b}}_{i}^{\mathrm{T}}\mathbf{b}_i+\hat{\mathbf{b}}_{i+1}\hat{\mathbf{b}}_{i+1}^{\mathrm{T}}\mathbf{b}_i+\ldots+\hat{\mathbf{b}}_{n}\hat{\mathbf{b}}_{n}^{\mathrm{T}}\mathbf{b}_i||, among which the vectors are pair-wise orthogonal. Thus ||\hat{\mathbf{B}}_{i}\hat{\mathbf{B}}_{i}^{\mathrm{T}}\mathbf{b}_i||\leq||\hat{\mathbf{B}}_{[i\sim n]}\hat{\mathbf{B}}_{[i\sim n]}^{\mathrm{T}}\mathbf{b}_i||, and we arrive in the conclusion that

\sin \theta_i\leq \sin \phi_i

So the decoding radius of SIC is larger.


References:

[1] C. Ling, “On the proximity factors of lattice reduction aided decoding”, IEEE Transactions on signal processing, Vol.59, No.6, pp. 2795–2808, 2011.

[2] Y.H. Gan, C. Ling and W.H. Mow, “Complex lattice reduction algorithm for low-complexity full-diversity MIMO detection”, IEEE Transactions on signal processing, Vol.57, No.7, pp. 2701–2710, 2009.


How to separate a graph? A first look at spectral method.

Planted partition can be intuitively regarded as, literally, separating a graph according to your plan. The problems such as bisection, k-coloring and maximum clique are known to be hard, and actually, most problems are hard unless proven easy.

In this post, we firstly try to classify the spectral graph model, and then given out the matlab code for partitioning a bipartite graph.

A general model for structural graph is:

\mathcal{G}(\psi,P): let \psi: \{ 1,\ldots,n\}\rightarrow \{ 1,\ldots,k\} which meaning the mapping from vertices to classes, and P be its generating matrix of size k\times k, where P_{i,j}\in\{0,1\}. So the connecting probability of any edge (u,v) is P_{\psi(u),\psi(v)}.

So the weighted adjacency matrix of \mathcal{G}(\psi,P) looks like

\[ \left( \begin{array}{cccc}<br /><br /><br /> P_{1,1}& P_{1,1}& P_{1,2}& P_{1,2}\\<br /><br /><br /> P_{1,1}& P_{1,1}& P_{1,2}& P_{1,2}\\<br /><br /><br /> P_{1,2}& P_{1,2}& P_{2,2}& P_{2,2}\\<br /><br /><br /> P_{1,2}& P_{1,2}& P_{2,2}& P_{2,2}<br /><br /><br /> \end{array} \right)\] ,

where the symmetric property of this matrix descents from that it is an in-directed graph.

We further specialize the bisection model hereby

  • Planted Bisection (\psi,p_1,p_2,q): the connecting probability of connecting to its own section is p_1 and p_2 respectively, while that of crossing is q.

Suppose we are now given a graph of this form, and want to simulate the process of partitioning all these nodes into two sections, with least possible crossing edges. Before delving into those technical details, we briefly describe a spectral partitioning principle for our simulation in this post:

The eigenvector of the second largest eigenvalue of the adjacency matrix \mathbf{A} is a slightly perturbed version of its generator matrix \mathbf{M}, which is of the form

\mathbf{M}=\[ \left( \begin{array}{cccc}<br /><br /> p_1 & p_1  & q & q  \\<br /><br /> p_1 & p_1  & q & q \\<br /><br /> q & q &    p_2 & p_2  \\<br /><br /> q & q &    p_2 & p_2 \\ \end{array} \right)\] .

Now we run a MATLAB simulation to simulate how that spectral partitioning method works.

  1. Generate a graph with n vertexes, and n_1 vertexes are connecting each other with probability p_1, while the other n-n_1 vertexes are self connecting with probability p_2. And that of their crossing is q.
clc;clear all;
n=800;
x=randperm(n);%put the sets among random positions
n_1=round(n/4);
ind_set1=x(1:n_1);
ind_set2=x(n_1+1:end);
p_1=0.8;
p_2=0.8;
q=0.001;
A(ind_set1,ind_set1)=rand(n_1,n_1)<p_1;
A(ind_set2,ind_set2)=rand(n-n_1,n-n_1)<p_2;
A(ind_set1,ind_set2)=rand(n_1,n-n_1)<q;
A(ind_set2,ind_set1)=rand(n-n_1,n_1)<q;
A=triu(A,1);%to make the adjacency matrix symmetric
A=A+A';
figure(1)
spy(A);

When this graph is generated, we can hardly tell any relation among its connection according to figure 1.


Again, we should bear in mind that the second eigenvector \mathbf{v}_2 of \mathbf{A} is a perturbed version of \mathbf{w}_2 of the generator matrix \mathbf{M}. (means the values of \mathbf{v}_2 are just a little deviated from \mathbf{w}_2) And why is \mathbf{w}_2 this important? because it is of the form [k_1p_1,k_1p_1,k_2p_2,k_2p_2,k_2p_2,k_1p_1], which reflects the relation of all these vertexes. So our second step of the code is

  1. Get the second eigenvector of \mathbf{A}, and re-sort the positions of these n vertexes.
[V D] = eigs(A, 2);
[useless ind_recover] = sort(V(:,2));
A_hat=A(ind_recover,ind_recover);
figure(2)
spy(A_hat);

Then we can see from figure 2 below that the relation it reflects is really a bisection.


References:

1. Daniel A. Spielman, “Spectral partitioning in the planted partition model”, Lecture notes(Lecture 21), 2009.

2. Frank McSherry, “Spectral partitioning of random graphs”, STOC, 2001.

3. David Gleich, “Spectral Graph Partitioning and the Laplacian with Matlab”, 2006. (Online resources)